


Survey Shows a Third of Horses Suffer From Lameness, Likely Caused by Limb Problems Rather Than Hoof

 During this year’s National Equine Health Survey (NEHS) 38% of horses were recorded as suffering from health problems and of these a third (32.9%) were categorized as lame. Consistent with previous surveys, lameness was shown to be more likely caused by conditions such as osteoarthritis in the limb rather than problems in the foot.
Blue Cross carries out NEHS in May each year, in partnership with the British Equine Veterinary Association (BEVA). It is sponsored by Dodson & Horrell and Zoetis and supported by the UK’s leading equestrian organizations and charities. This year saw a 14% increase in participation compared to 2015, with survey records returned for almost 16,751 horses, ponies, donkeys and mules and 5,635 people taking part. Most horses were kept in livery or a private yard and used for leisure and hacking. 62% of horses were healthy (i.e. had no health problems recorded) and 38% of horses had one or more health problems recorded. The most frequent disease syndrome recorded was lameness, accounting for one third of all problems reported.
Lameness has been consistently seen as the most common syndrome affecting horses in the NEHS results year on year. In the latest survey, a total of 32.9% of horses with health problems (24.4% in 2015) were recorded as lame. Overall, as in previous years, lameness in the limb was more common than lameness caused by problems in the foot.
A breakdown of the types of lameness revealed that 47.4% were recorded as suffering from proximal limb lameness (the limb above the foot), 31.9% from causes of foot lameness other than laminitis, and 20.7% from laminitis. Degenerative joint disease (including foot and proximal limb) was the most frequently reported single cause of lameness (41.2% of all lameness) and the most frequently reported joint affected by DJD was the hock (15.3% of all lameness).
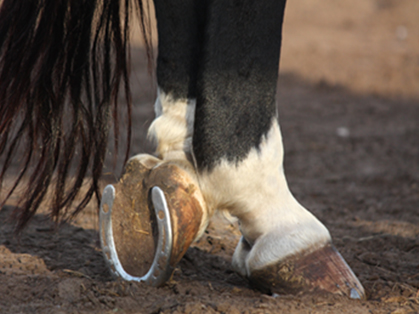
Reports of foot lameness (excluding laminitis) more than doubled this year at 10.5% (4.5% in 2015) of all syndromes reported with pus in the foot being the most frequently recorded problem. This could possibly be attributed to the persistent wet weather during and prior to the survey, which can increase susceptibility to the condition.
Josh Slater from the Royal Veterinary College, who is a member of BEVA’s Health & Medicines Committee and analyzed the NEHS data, said: “The data gleaned from the survey remains consistent year on year, confirming the reliability of our findings for benchmarking, referencing, and research. This year’s increase in overall lameness may be attributed, in part, to the higher incidence of pus in the foot but may also be because owners are becoming more aware of lameness issues. Ongoing research on lameness has generated significant media coverage over the past year, helping to raise understanding of the importance of accurate diagnosis and treatment both from welfare and performance perspectives.”
The six most notable disease syndromes identified in the 2016 National Equine Health Survey of horses/ponies recorded as suffering from health problems are:
1. Lameness 32.9% including laminitis (compared to 24.4% in 2015, 21% in 2014, 19.2% in 2013 and 12.9% in 2010-12).
2. Skin diseases (sweet itch, mud fever, rainscald, external parasites, skin tumors and wounds) 25.5% compared to 17.2% in 2015 (18.3% in 2014, 14.6% in 2013 and 15.2% in 2010-12).
3. Laminitis 6.8% compared to 6.4% in 2015 (7.1% in 2014, 4.4% in 2013 and 3.6% in 2010-12).
4. PPID (‘Equine Cushing’s Disease) 6.6%. This is similar to the high prevalence of PPID reported in 2015 (6.4%) and 2014 (5.6%) and possibly reflects increased surveillance through sponsored testing programs as opposed to true increases in prevalence from the pre-2014 surveys.
5. Recurrent Airway Obstruction 5.6% compared to 6.7% in 2015 (6.9% in 2014, 4.2% in 2013 and 3.6% in 2010-12).
6. Back problems 5.5% compared to 7% in 2015 (7.7% in 2014, 5% in 2013 and 3% in 2010-12).
Gemma Taylor, Education Officer at Blue Cross said: “The significant increase in participation again this year shows that owners and keepers of horses are really getting behind the Survey and recognizing its importance in safeguarding the future health of the UK’s horses. Over the past yea,r NEHS data has been referred to in leading equestrian and veterinary media, showing its credibility as a valuable benchmarking reference.”
Further news on the important findings of this year’s NEHS will be disclosed as it becomes available. The 2016 NEHS survey results are now available. To download a copy visit http://www.bluecross.org.uk/nehs2016results and to register for next year’s survey please visit www.bluecross.org.uk/nehs.